By Mark Brooks
The Pandemic is ending, you’re vaccinated and looking forward to travelling for the first time in two years. What is the most responsible, lowest carbon cost of transportation in Canada Today? The answer to this question is harder to find than you might think and often as not the opposite of what you might see in other nations. Crunching the numbers reveals a surprise. In Canada air travel usually has the lowest carbon foot print, beating VIA Rail and driving.
If you are surprised to discover that the most carbon efficient way to travel is by air, you are not alone. Unfortunately Canadian consumers are often mis-lead by eye candy info graphics from other parts of the world promoted in support of a political or economic narrative. These utilizes questionable statistics from European sub compact cars or short line electric rail that do not exist in Canada. Some website, such as the “Visual Capitalist” and far left political organizations such as Stayground.org have elevated this misinformation to an art form.
Canadas passenger rail company, VIA Rail, has been quick to recognize the potential marketing opportunities by publishing emissions numbers that appear to be based more on wishful “in the future when “ thinking than real data. No doubt VIA rail is working hard to reduces its carbon footprint but so too are aviation and automotive companies. With electric cars becoming more widely available and air travel switching to net zero carbon fuel, the answer in the future can be that every mode of transportation will have a net zero carbon footprint.
But right now, what is the most carbon efficient way to travel in Canada in 2022?
The answer is it depends. It depends on the geography of the route and distance you plan to travel. It depends on how many people are traveling with you. It depends on local access to public transportation such as an airport or rail station. Time available, poor weather as well as your own risk tolerance also play a role.
While some in the media mislead their readers by reprinting idealized numbers from short trips between European cities in full trains and packed sub compact cars, the reality in Canada is much different. Our cars are rarely full and we drive on highways congested by truck traffic and covered in snow six months of the year. Our rail is not electrified and serves only a limited number of cities over thousands of kilometers. VIA Rails diesel-guzzling locomotives must haul sleeping and dining as well as passenger cars on congested tracks overwhelmed by bulk carriers that are the life blood of the national economy.
Air travel has its own challenges. 30% of Canadas air passengers are funneled through a single congested airport that is the most expensive in North America, Toronto Pearson. Every week unique Canadian weather events effect air, road and rail travel from coast to coast.
To help you make sense of these constraints we use real world data to compare Air, Road and Rail travel options available to Canadians today. We have built two charts to represent two typical routes using three proven real world data sources. The first is the the real world data provided by ICAO (International Civil Aviation Organization), a United Nations Agency based in Montreal, Canada, on aviation emissions. The second is the Government of Canadas Fuel Consumption Guide for new cars. The third, the Katz-Rosene 2020 study of the real carbon cost of traveling on Via Rail published in Canadian Geography. For consistency we will use road travel as a baseline as it is the single most common method of travel. To be consistent we will take the total emissions per person per trip type and divide it by the road distance travelled.
A trip from Montreal to Halifax.
According to the ICAO calculator the emissions for a one way flight between Montreal to Halifax is 101.3 kg per passenger. For consistency we will show this number in relation to the road distance which is 1242 km. So that is an average of 81 g/km per passenger reported by the airlines that service this route.
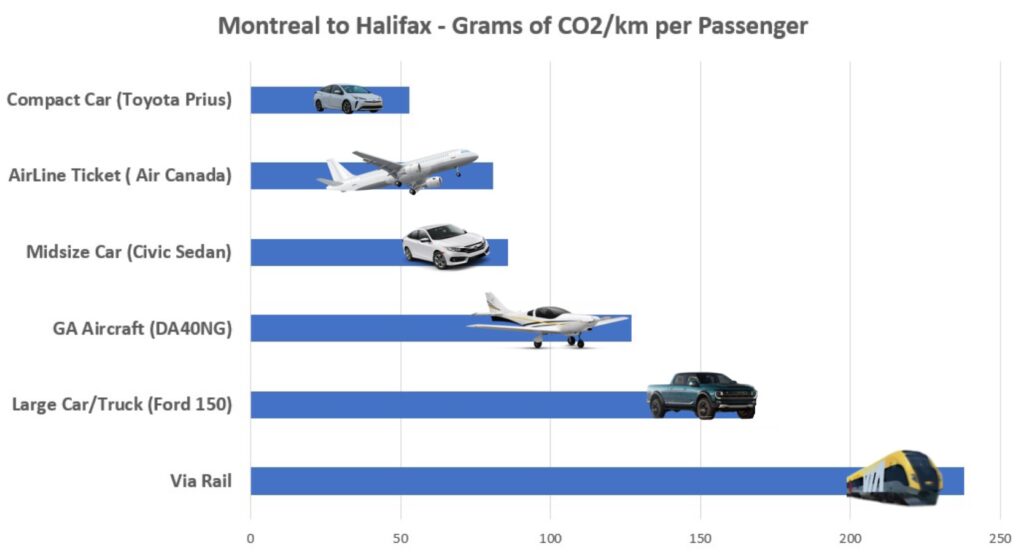
For rail, we reference the Katz-Rosene study done in 2020, which shows a carbon foot print per passenger of 218 g/km over a distance of 1346km for a total emissions of 293.4 Kg of CO2. This works out to 236 g/km per passenger when equated to the road distance of 1242 km.
We will use the governments fuel guide for several popular new car and truck models, that range from 105 to over 500 g/km. This number will be divided in half with the assumption that their will be two travelers per vehicle. Therefore a Toyota Prius at 106 g/km is 53 g/km per passenger. A Honda civic Sedans 172 g/km is 86 g/km per passenger. A Ford F150 4×4 at 307 g/km becomes 154 g/km per passenger.
In honour of the just introduced Canadian Luxury Tax on new GA (General Aviation) aircraft we will also show the carbon foot print of the popular DA40NG. The four seat DA40NG is made in London Ontario by Diamond Aircraft and according to aviation planning app Foreflight will use 100 litres of fuel for this trip. We will also assume that it has two passengers. Using the ICAO standard of 3.16 kg per litre of jet fuel This is equal to a carbon foot print of 316 kg total and or 127 g/km per passenger.
A longer trip from Toronto to Vancouver.
By air the ICAO calculator show the emissions data of 248 kg per passenger. Utilizing a road distance of 4500 km that is 55 g/km (grams per passenger kilometre).
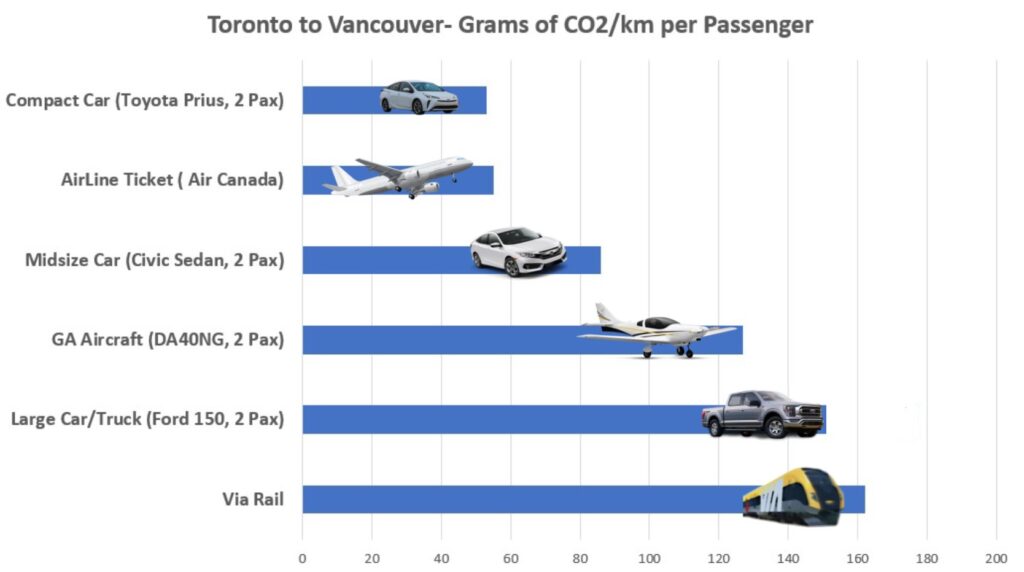
For rail, we again reference the Katz-Rosene study done in 2020, which shows a carbon foot print of 724 kg of emissions or 162 g/km per passenger. It should be noted that this is three time the emissions of traveling by air. Even the emissions of 125 g/km per passenger for a “Luxurious” new DA40 NG personal aircraft easily beats the train.
Real world data reveals a simple truth: Air travel is one of the most carbon efficient way to travel in Canada.
Much of what you may have read about modes of travel and emissions from other parts of the world are, at best, not applicable to Canadas geography and infrastructure. In Canada, the tyranny of geography in our vast landscape is not open to wishful thinking. The laws of physics and distance are non-negotiable. If you need to travel in Canada, please fly.
References:
ICAO Carbon Emissions Calculator
2021 Fuel Consumption Guide (nrcan.gc.ca)
Why the train may not be the greenest way to travel across Canada | CBC News
There is no rail to Resolute
Also, the farmland which now occupies the site has a bigger carbon footprint than a would-be airport. those occupying it paying almost no rent to the gov for 50 years want to continue the status quo.
They need to decide one way or another. The reason being the limbo over the airport is also keeping all the surrounding non-federal owned lands in limbo – in fact they have a special zoning which says they need to be kept in limbo until which time when the fed decides what to do with their land.